What Malta is building
Apartments up, everything else down
Summary
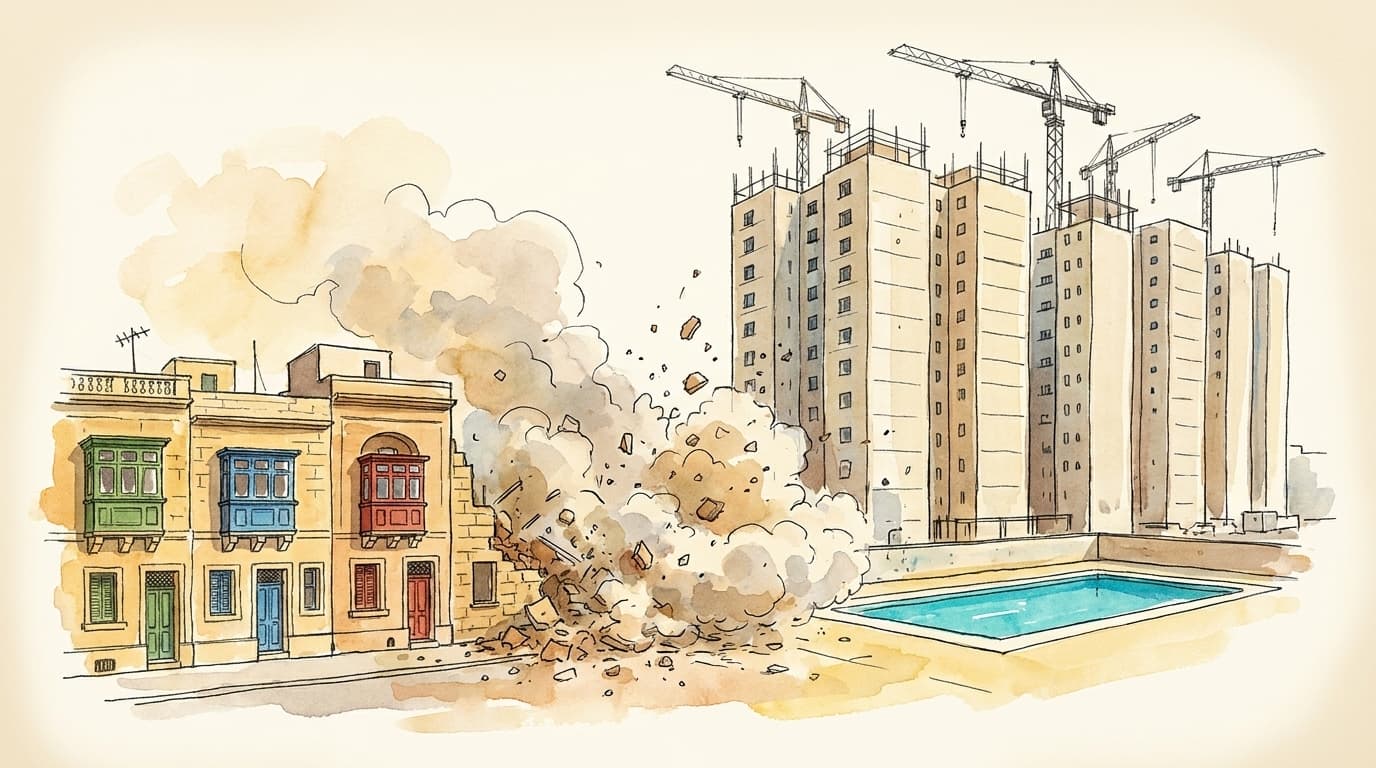
Malta is in the middle of an apartment and demolition boom. Applications mentioning apartments have 6x'd since 2000, demolition applications have 4x'd, and pool applications have also surged. The character of development has fundamentally shifted.
Key findings
Development types by volume (PA applications, all years)
Each application is assigned to a single category by priority order (demolition+apartments first, then pool, then apartments, then garage, etc.) so the counts don't double-count overlapping keywords. See the SQL below for the exact rule.
| Category | Applications | Approval rate |
|---|---|---|
| Garage | 46,475 | 84.0% |
| Apartments (no demolition) | 17,736 | 90.5% |
| Change of use | 14,313 | 81.1% |
| Pool | 12,941 | 92.3% |
| Demolition + Apartments | 5,626 | 92.5% |
| Penthouse | 5,109 | 86.2% |
| Office | 4,166 | 83.3% |
| Hotel | 628 | 82.7% |
| Warehouse | 603 | 79.2% |
| Fuel station | 145 | 65.6% |
Demolition + apartment projects have the highest approval rate at 92.5%. These are typically teardowns of older buildings replaced with multi-unit apartment blocks.
The apartment explosion (applications per year mentioning "apartments")
| Year | Apartments | Demolitions | Pools | Hotels | Total PA |
|---|---|---|---|---|---|
| 2000 | 251 | 246 | 188 | 31 | 6,731 |
| 2005 | 773 | 467 | 282 | 22 | 8,012 |
| 2010 | 479 | 342 | 241 | 14 | 5,252 |
| 2015 | 715 | 579 | 349 | 40 | 4,934 |
| 2016 | 1,222 | 910 | 500 | 76 | 7,958 |
| 2017 | 1,689 | 1,254 | 758 | 77 | 11,107 |
| 2018 | 1,887 | 1,554 | 845 | 79 | 11,464 |
| 2019 | 1,569 | 1,238 | 844 | 73 | 9,987 |
| 2020 | 1,170 | 930 | 848 | 59 | 8,957 |
| 2021 | 1,336 | 908 | 952 | 52 | 9,026 |
| 2022 | 1,238 | 897 | 918 | 48 | 8,050 |
| 2023 | 1,288 | 893 | 804 | 61 | 7,788 |
| 2024 | 1,504 | 1,076 | 810 | 71 | 8,676 |
| 2025 | 1,462 | 1,075 | 865 | 76 | 8,345 |
| 2026 | 584 | 462 | 350 | 51 | 3,184 |
Key trends
Apartments: From 251/year (2000) to ~1,500/year (2024–2025). A 6x increase.
Demolitions: From 246/year (2000) to ~1,075/year (2024–2025). A 4x increase. The demolition boom peaked in 2018 at 1,554 applications — Malta was tearing down more buildings that year than the total number of planning applications in some earlier years.
Pools: From 188/year (2000) to ~860/year (2024–2025). A 4.5x increase. Pool applications peaked in 2021 at 952.
Hotels: Relatively stable at 20–80/year, but with a noticeable post-2014 increase (possibly tourism boom).
The demolition-to-apartment pipeline
In 2018 alone, there were 1,554 demolition applications and 1,887 apartment applications. These are closely related — older townhouses and villas are being demolished and replaced with apartment blocks. This is the physical transformation of Malta's urban landscape.
With a 92.5% approval rate, demolition-to-apartment conversions are among the most reliably approved application types.
Media sources
- "Permits for new dwellings in Malta have increased by 230% since 2013" — MaltaToday. The 230% increase 2013–2017 corroborates the story's six-fold apartment claim.
- "Building mad: Record-breaking 13,000 permits issued by PA" — MaltaToday. Confirms the 2017–2018 peak the story identifies as the apex of the boom.
- "Building Boom: 12,500 dwelling planning applications approved in 2019, one of highest ever" — Malta Independent, 22 March 2020. Backs the apartment-dominance claim with NSO/PA data.
- "TMID Editorial: Malta's construction boom" — Malta Independent, 21 February 2026. Contemporary editorial recapping the demolition-to-apartment pipeline the story documents.